IES Blog

Institute of Education Sciences

Rethinking Connections Between Research and Practice in Education

IES-funded researchers from the Center for Research Use in Education (CRUE) at the University of Delaware recently learned that their article, “Rethinking Connections Between Research and Practice in Education: A Conceptual Framework,” was the 8th most-read article in any AERA journal in 2018!

In the article, the authors argue that “Recent efforts to improve the quality and availability of scientific research in education, coupled with increased expectations for the use of research in practice, demand new ways of thinking about connections between research and practice.”

Under the Every Student Succeeds Act (ESSA), education leaders must use evidence to inform their practice. However, the CRUE researchers argue that this simple framing “risks reducing evidence use to an administrative task rather than multiple activities constituting a political and social practice within a complex organizational process.” In fact, “the field lacks a comprehensive understanding of what evidence-based decision-making looks like in practice—for example, when is evidence brought into the decision-making process? Who engages with it? How is it understood in the local context? How often is it reviewed?”

CRUE’s research on this issue reveals gaps in the assumptions and perspectives of the research and practice communities, including the usefulness of research products; the nature and quality of research; the problems that research addresses; the structures, processes, and incentives for research production and use; and the specific relationships between the communities. They present a conceptual framework that highlights how these differences in understanding affect both the depth of research use and the depth of research production. Their article in Educational Researcher explains each of these and how they work together.

The framework shows that increasing education research use in practice is a complex, bidirectional issue, in which characteristics of both communities play a part: researchers need to produce work that is “decision-relevant,” and practitioners need to make decisions that are “research-attuned.” 


IPEDS Finance Data Reveal How Pension Benefits May Contribute to the Growth of Public Postsecondary Institutions’ Financial Liabilities

In the long-standing conversation of high college costs, ever wonder what public colleges and universities owe? For Fiscal Year (FY) 2017, the National Center for Education Statistics (NCES) using the Integrated Postsecondary Education System (IPEDS) found that 1,624[1] public institutions carried debt and total financial obligations of $451 billion in current dollars (see figure 1).

New finance data from IPEDS can now provide more insight about these obligations than was previously available.

Several common financial obligations or liabilities[2] can be found across all U.S. postsecondary institutions. A portion of an institution’s liabilities can be attributed to pension benefits and contributions (i.e., pension liabilities). Since fiscal year 2015, IPEDS collected data on these obligations as a specific part of the total debt held by public postsecondary institutions.  For example, the total amount of pension benefits and contributions that public institutions owed their employees in FY 2017 was $95 billion (see figure 1).


Before FY 2015, institutions did not have to report to NCES their pension liabilities and the total liabilities for public institutions were $304 billion in FY 2014.  However, after the change in reporting standards, the total liabilities for all public institutions jumped to $395 billion in FY 2015. This increase is greater than increases in all other fiscal years from 2012 to 2017. This finding suggests that the implementation of the new pension reporting standards may have contributed to the change in the increasing trend of total liabilities data.

Reporting Change in Context

Prior to the revised pension reporting standards, dating back to 1997, public institutions reported the difference between their annual required contribution to the pension plan(s) and the actual annual contribution (e.g., net pension obligation). The revised standards—known as Government Accounting Standards Board (GASB) Statements 67 and 68—require institutions to report the entire unfunded pension amount (e.g., net pension liability), not just the amount of deficiency in annual payments.

Including the full current pension liability of the institution instead of the annual shortfall in pension funding of the institution resulted in large shifts in the balance sheet of many public institutions. For example, if an institution had a total of $2 million in pension liabilities, prior to 2015 this institution would not report the $2 million in net pension liabilities, just the amount below the required contribution for that year that was actually paid. Now, this institution must report the full $2 million in net pension liabilities, even if the annual required contribution had been paid in full. This revision of the financial reporting standards resulted in increased transparency and accuracy of the total amount of liabilities reported by institutions.

Additional IPEDS Resources

NCES encourages educational researchers to use IPEDS data—a primary source on U.S. colleges, universities, and technical and vocational institutions. For more information about the IPEDS data, visit the IPEDS Survey Components page.

While finance data from the IPEDS collection may seem to be targeted for accountants and business officers, researchers interested in a postsecondary institution’s financial health can explore through expense and revenue metrics, resulting in possible data-driven, bellwether information. To learn more about an institution’s finance data, in particular its pension benefits, click here for the current finance survey materials; archived changes to the survey materials in 2015–16 (FY 2015)—such as the implementation of the new pension reporting standards; and links to Video Tutorials, FAQs, glossary definitions and other helpful resources.  


 By Bao Le, Aida Ali Akreyi, and Gigi Jones


[1] This total includes 735 four-year public institutions, 889 two-year public institutions, and 63 administrative public system offices (41 four-year and 22 two-year offices). Administrative system offices can report on behalf of their campuses. The four non-Title IV-eligible U.S. service academics are not included.

[2] Liabilities include long-term debts (current and noncurrent) as well as other current and noncurrent liabilities such as pensions, compensated absences, claims and judgments, etc.

New Report on Crime and Safety in Schools and College Campuses

Crime in the nation’s schools and college campuses has declined overall during the past two decades, according to a report released on April 17, 2019. Indicators of School Crime and Safety 2018 highlights new information on a wide array of data points, including youth opioid use, perceptions of bullying, and active shooter incidents in educational settings. The report also covers topics such as victimization, school conditions, school environment, safety and security measures at school, and criminal incidents at postsecondary institutions.

In 2017, students ages 12–18 experienced 827,000 total victimizations (i.e., theft and nonfatal violent victimization) at school and 503,800 total victimizations away from school. These figures represent a rate of 33 victimizations per 1,000 students at school, compared to 20 victimizations per 1,000 students away from school. From 1992 to 2017, the total victimization rate and rates of specific crimes—thefts, violent victimizations, and serious violent victimizations—declined for students ages 12–18, both at school and away from school.

This edition of Indicators of School Crime and Safety includes an analysis of active shooter incidents, which represent a small subset of the possible violent incidents that occur at schools. While rare, these events are of high concern to all those interested in the safety of our nation’s students. From 2000 to 2017, there were 37 active shooter incidents at elementary and secondary schools and 15 active shooter incidents at postsecondary institutions. During this period, there were 153 casualties (67 killed and 86 wounded) in active shooter incidents at elementary and secondary schools, and 143 casualties (70 killed and 73 wounded) in active shooter incidents at postsecondary institutions.

Between July 1, 2015 and June 30, 2016, the most recent period available, there were 18 homicides of school-age youth (ages 5–18) at a school out of the 1,478 homicides of school-age youth in the United States. During the same period, 3 of the 1,941 total suicides of school-age youth occurred at school.

In 2017, about 20 percent of students ages 12–18 reported being bullied at school during the school year. Between 2005 and 2017, the percentage of students who reported being bullied at school declined overall and for most of the student and school characteristics examined.
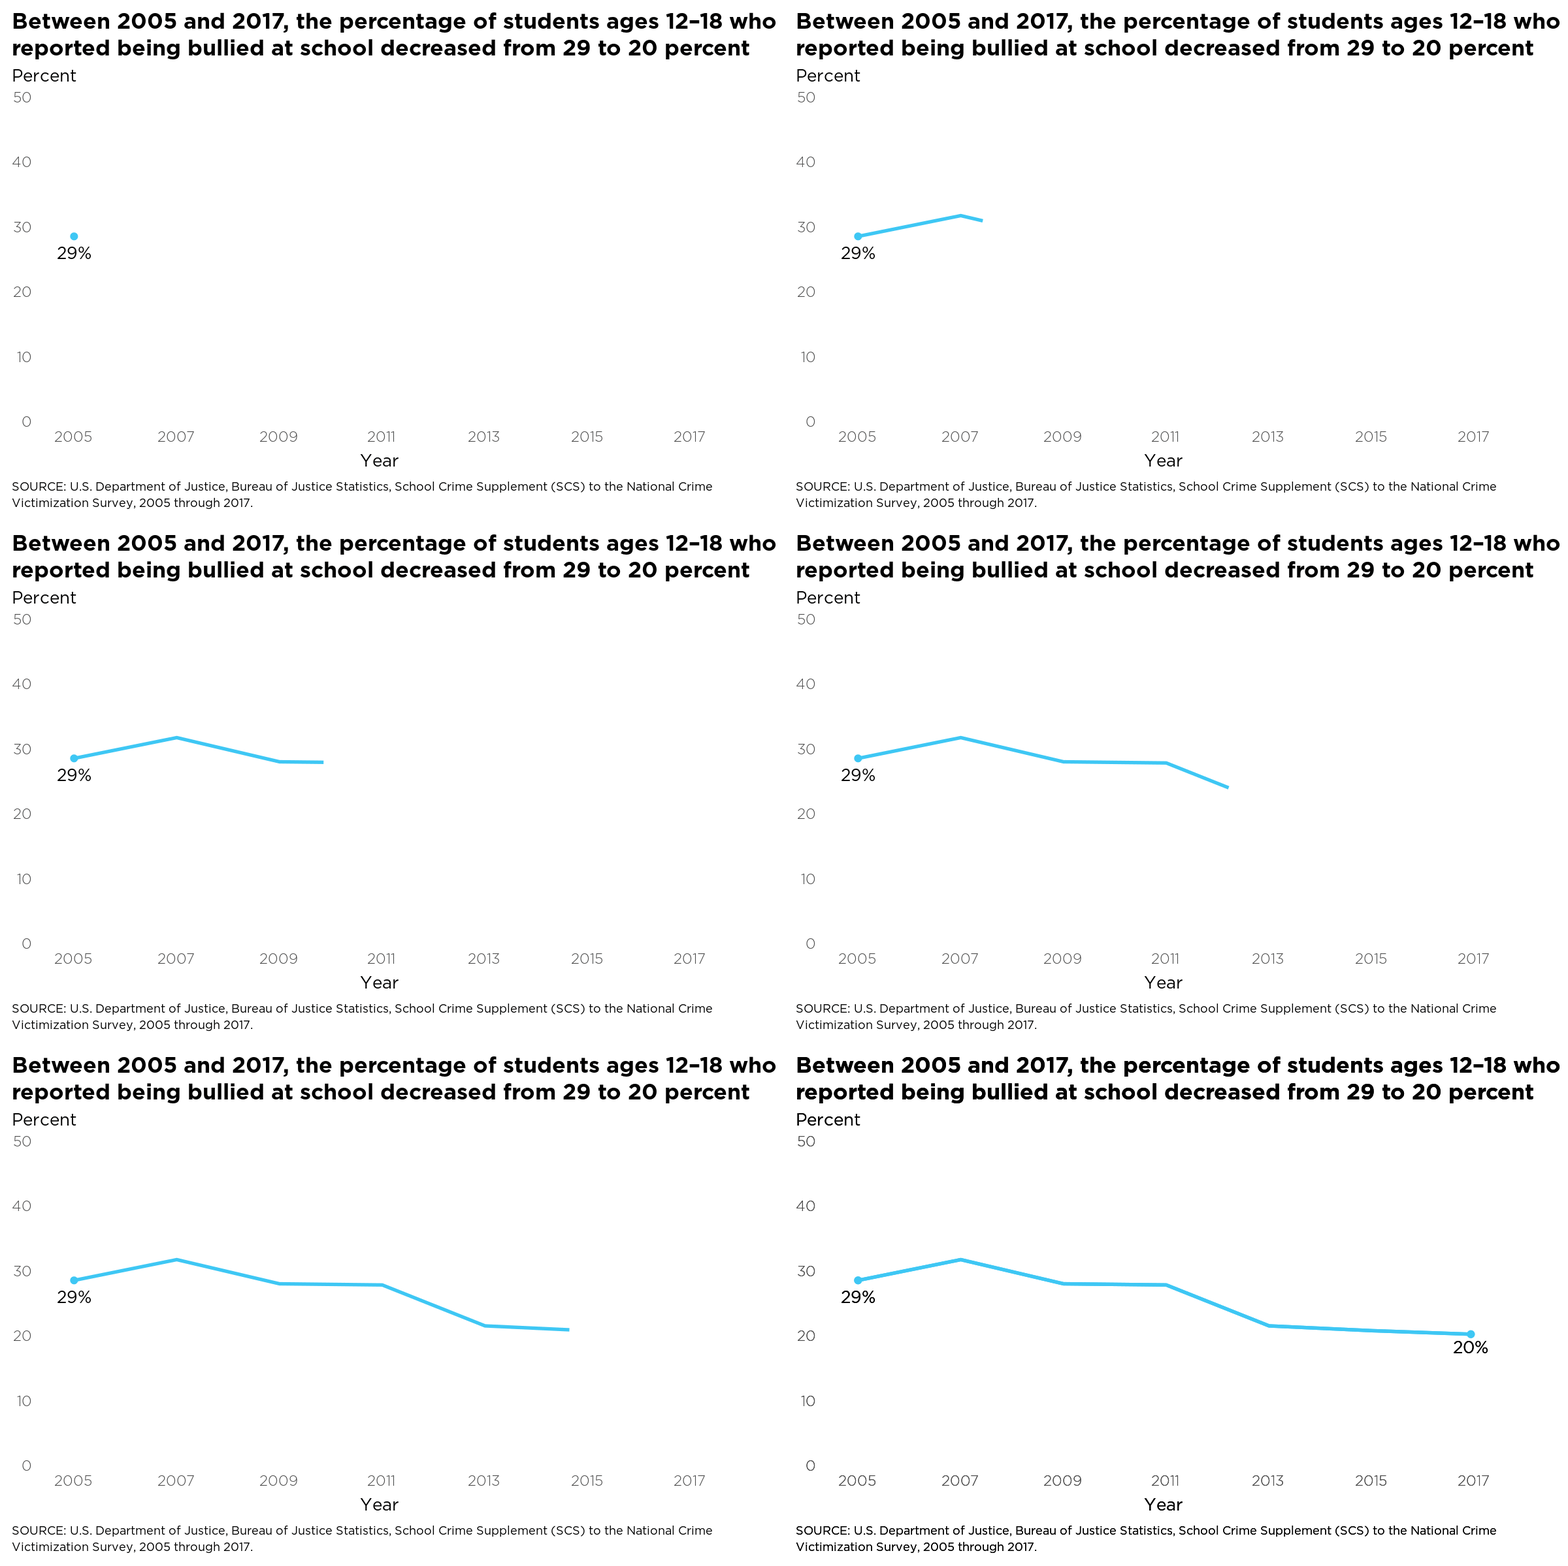


Of the students who were bullied in 2017, about 56 percent felt that those who had bullied them had the ability to influence what other students thought of them. A higher percentage of female students (62 percent) than male students (48 percent) reported that those who bullied them had the ability to influence what other students thought of them.


The new report included a special analysis that shows that the percentage of 8th-graders who reported using heroin during the past 12 months decreased from 1.4 percent in 1995 to 0.3 percent in 2017. The percentage also decreased from 1.1 to 0.2 percent for 10th-graders and from 1.1 to 0.4 percent for 12th-graders during the same period. This 0.4 percent of 12th graders reflects 15,900 students, who were recent users of heroin. The use of OxyContin and Vicodin during the past 12 months also generally decreased for 8th-, 10th-, and 12th-graders between 2005 (the first year of data collection for these survey items) and 2017.


There were also decreases for other types of substance abuse. The percentage of students in grades 9–12 who reported using alcohol at least once during the previous 30 days decreased from 47 to 30 percent between 2001 and 2017. Also, the percentage of students in grades 9–12 reporting marijuana use at least 1 time during the previous 30 days in 2017 (20 percent) was lower than the percentage for 2001 (24 percent).

Other findings – elementary and secondary schools

  • About 99 percent of students ages 12–18 reported that they observed the use of at least one of the selected safety and security measures at their schools in 2017. The three most commonly observed safety and security measures were a written code of student conduct (95 percent), a requirement that visitors sign in and wear visitor badges or stickers (90 percent), and the presence of school staff (other than security guards or assigned police officers) or other adults supervising the hallway (88 percent).
  • About 6 percent of students ages 12–18 reported being called hate-related words at school during the school year in 2017, representing a decrease from 12 percent in 2001. This percentage also decreased between 2001 and 2017 for male and female students as well as for White, Black, and Hispanic students.
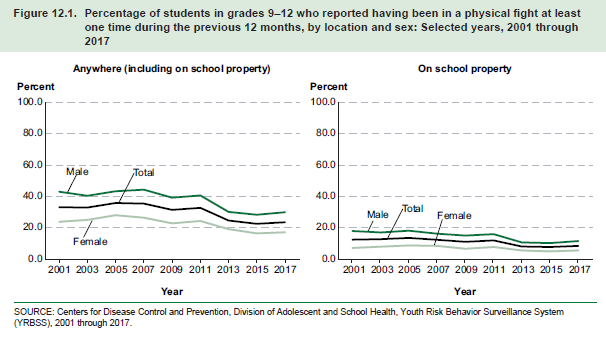
  • The percentage of students in grades 9–12 who reported having been in a physical fight anywhere in the previous 12 months decreased between 2001 and 2017 (from 33 to 24 percent), as did the percentage of students in these grades who reported having been in a physical fight on school property (from 13 to 9 percent).


Other findings – postsecondary Institutions

  • The number of on-campus crimes reported in 2016 was lower than the number reported in 2001 for every category except forcible sex offenses and negligent manslaughter offenses. The number of reported forcible sex crimes on campus increased from 2,200 in 2001 to 8,900 in 2016 (a 305 percent increase).
  • Race, religion, and sexual orientation were the categories of motivating bias most frequently associated with the 1,070 hate crimes reported on college campuses in 2016.

To view the full report, please visit https://nces.ed.gov/pubsearch/pubsinfo.asp?pubid=2019047.

Inequity Persists in Gifted Programs

The National Center for Research on Gifted Education (NCRGE) at the University of Connecticut, in Phase I of a rigorous research agenda, examined how academically-gifted students are identified and served in three states in order to provide systematic information for the field. The research team focused especially on the representation of historically underserved groups in gifted education.

NCER recently spoke with the Center’s Principal Investigator, Del Siegle, a nationally-recognized expert on gifted education. 

What is the biggest challenge facing gifted educators today?

Unfortunately, many of our nation’s brightest students from underserved populations (e.g., Black, Hispanic, English Learner, and/or free and reduced-price lunch eligible) are not being identified as gifted and do not receive gifted education services. About 80% of states that completed the most recent National Association for Gifted Children’s State of the States survey indicated that underrepresentation of students from underserved populations was an important or very important issue in their state.

What did you find in your study of identification of underserved students for gifted programs?

During Phase I of our work, we analyzed standardized student achievement test data from three states that mandate gifted identification and programming. We found that schools were less likely to identify students from underserved groups as gifted—even in cases where the underserved child had similar achievement test scores. For example, students with similar test scores who received free and reduced price lunch were less than half as likely to be identified as gifted as students who didn’t receive free or reduced price lunch.

What identification practices are schools using?

Cognitive tests and teacher nominations were the most common identification tools across the three states we studied. The majority (90% to 96%) of the districts in all three states used these practices to select students. Identification for gifted services occurs most often in third grade. Districts seldom reassess identified students once they are identified and only about half reassess non-identified students in elementary schools at regular intervals. Screening all children and using a variety of identification criteria showed promise for reducing under-identification in one of our states.

How are students being serviced in gifted programs?

In the three states we studied, schools primarily focused on critical thinking and creativity followed by communication skills, research skills, and self-directed projects.  Mathematics and reading language arts acceleration was much less of a focus and were ranked among the bottom third of focus areas. Gifted students seldom receive gifted programming in core academic areas. Only 29% of the schools provided a separate gifted curriculum in reading/language arts. Only 24% of the schools had a separate gifted curriculum in mathematics. Gifted students spent 5 hours or more each week in regular education mathematics and reading/language arts classrooms. Of the 74% of schools reporting using pull-out services, only 32% offered separate gifted curriculum in reading/language arts and 28% offered separate gifted curriculum in math. 

What about gifted student growth in mathematics and reading?

In 3rd grade, gifted students are approximately 2 grade levels ahead of students not identified as gifted, but gifted students grow more slowly than non-gifted students between 3rd and 5th grade. Most grouping arrangements for gifted students had no impact on the growth of academic achievement. We believe much of this has to do with the limited advanced mathematics and reading instruction gifted students receive in their classrooms and gifted programs.

What is the next step in your research?

We are examining the effect of attending dedicated gifted classes in core content areas on academic achievement in reading/language arts and mathematics in a large, ethnically, economically, and linguistically diverse urban school district. Our research will compare the reading/language arts and mathematics achievement of gifted students in three different settings: schools offering a full-time gifted-only program with gifted classes in all subject areas, schools offering a part-time gifted-only program with gifted classes in mathematics, and schools offering a part-time gifted-only program with gifted classes in reading/language arts.

Celebrating School Library Month: A Look at Library Media Centers


April is School Library Month, which recognizes the important role that school librarians and libraries play in K-12 education. More than 90 percent of public elementary and secondary schools have a library media center, according to the National Teacher and Principal Survey (NTPS), which collects data about school librarians and libraries. In honor of School Library Month, here are some facts and figures from the NTPS.


Library staff

  • Public schools employed approximately 56,000 full-time librarians and library media specialists in the 2015–16 school year, as well as an additional 17,600 part-time librarians and library media specialists.

  • Since there were more library media centers (82,300) than librarians and since some schools may employ more than one librarian, not every school with a library media center also employed a school librarian. On average, had 0.7 full-time and 0.2 part-time librarians and library media specialists.


Library media centers

  • In the 2015–16 school year, 91 percent of public schools had a school library media center. Overall, there were approximately 82,300 public elementary and secondary schools with a library media center.

  • The presence of school library media centers varied by the grade levels taught at schools. In the 2015–16 school year, higher percentages of primary schools (96 percent) and middle schools (95 percent) had library media centers than high schools (80 percent) or combined schools (79 percent).

  • The presence of school library media centers also varied by the type of community in which schools were located. About 88 percent of city-based schools had a library media center in the 2015–16 school year, which was lower than the percentage of schools located in suburban areas (92 percent) and rural areas (94 percent).

  • While the vast majority of public schools have a library media center, the percentage fell slightly between school years 2003–04 and 2015–16, from 94 percent to 91 percent, respectively (see Figure 1 below).


Figure 1. Percentage of public schools reporting the presence of a library or library media center: 2003–04 to 2015–16

SOURCE: U.S. Department of Education, National Center for Education Statistics, Schools and Staffing Survey (SASS), “Public School Data File,” 2003–04, 2007–08, 2011–12, and National Teacher and Principal Survey (NTPS), "Public School Data File,” 2015–16.


More information about school libraries, public libraries, and academic libraries is available through the Library Statistics Program and the NCES Fast Fact on Libraries. In addition, analysts can access these data using DataLab to conduct their own analyses of NTPS and other National Center for Education Statistics (NCES) surveys.


By Maura Spiegelman