IES Blog

Institute of Education Sciences

NCES Centralizes State-Level Data in New Digest State Dashboard

With hundreds of tables to explore, the Digest of Education Statistics offers a wide array of education data. For the first time, NCES is visualizing Digest data in a new Digest State Dashboard. The Dashboard provides a centralized location for state-level Digest data, so users can easily find it all in one place. As the first-ever Digest data tool, the Dashboard helps you not only find and use NCES data but also better understand the education landscape of an individual state.

In alignment with NCES’s goal to promote diversity, equity, and inclusion in our products, the Dashboard provides data for all entities that are part of the United States: the 50 states, the District of Columbia, the Bureau of Indian Education, and outlying areas—i.e., American Samoa, Guam, Northern Marianas, Puerto Rico, and U.S. Virgin Islands.

Digest Dashboard Topics

  • Public school enrollment
  • Public school student characteristics
  • Public school teachers
  • Public schools
  • Private school education
  • Reading and mathematics assessments
  • 4-year adjusted cohort graduation rate (ACGR)
  • Public school expenditures
  • Postsecondary enrollment
  • Postsecondary institution and student charges

For each of these entities, the Dashboard highlights the most recently published Digest data on topics of interest (see textbox). The selected topics represent key indicators of a state’s education landscape, and data are presented for each entity and topic whenever available.

To help make data interpretation easier, the Dashboard presents data in figures—like bar charts, line graphs, and brief tables—that allow you to interact with the data in ways not possible with the static tables. If you’ve ever explored the Condition of Education—which will be updated next month (May 2024)—the Dashboard’s figures should look very familiar, as they were designed to mirror the appearance and functionality of the Condition’s interactive figures. Similarly, in the Dashboard, you can

  1. modify the figure by selecting characteristics and years to include;
  2. share the figure on various platforms; and
  3. download the figure and the data used in the figure. 

The Dashboard also provides links to other NCES state-level data tools, centralizing these resources and providing a more detailed picture of each state’s educational landscape. You can find state-specific links to NAEP State Profiles, the NTPS State Dashboard, and the PIAAC Skills Map on each state’s page. Plus, you can find links to other NCES data tools, like the EDGE ACS Dashboard and the IPEDS Trend Generator, on the Dashboard’s homepage.

The Dashboard will be continuously updated throughout the year—as data become available in the Digest—making it a great source of up-to-date information for policymakers, researchers, practitioners, and parents/families. In May 2024, several figures will be updated, including two postsecondary figures on enrollment and institutions and student charges. Be sure to check back and follow NCES on XFacebookLinkedIn, and YouTube and subscribe to the NCES News Flash to stay informed when these and other updates are made. You can also continue to explore the Digest tables to find even more state-level data.

Summer Learning During the COVID-19 Pandemic

As the school year comes to a close, many families are considering opportunities to continue learning over the summer months. Summer learning has often been seen as a way to supplement instruction during the regular school year. The U.S. Department of Education’s “COVID-19 Handbook” notes that summer learning “can offer another opportunity to accelerate learning, especially for those students most impacted by disruptions to learning during the school year.” Data from the Household Pulse Survey (HPS), which NCES developed in partnership with the U.S. Census Bureau and other federal statistical agencies, explores access to summer learning opportunities by school type, racial/ethnic group, household educational attainment level, and income level.

The HPS1 provides data on how people’s lives have been impacted by the coronavirus (COVID-19) pandemic. Phase 3.2 of the HPS introduced questions on the summer education activities of children enrolled in public or private school or homeschooled, following the end of the normal school year in spring 2021. Adults 18 years old and over who had children under 18 in the home enrolled in school were asked if any of the children had attended a traditional summer school program because of poor grades; attended a summer school program to help catch up with lost learning time during the pandemic; attended school-led summer camps for subjects like math, science, or reading; and/or worked with private tutors to help catch up with lost learning time during the pandemic. Adults were allowed to select all categories that applied. Data from Phase 3.2 of the HPS, covering September 15 to 27, 2021, are discussed in this blog post.

Among adults with children enrolled in public or private school or homeschooled, 26 percent reported children were enrolled in any summer education activities after the end of the normal school year in spring of 2021 (figure 1). The most reported summer education activity was attending a summer school program to catch up on lost learning time during the pandemic (10 percent). Eight percent reported children attended school-led summer camps for subjects like math, science, or reading and 7 percent each reported children attended a traditional summer school program because of poor grades or worked with private tutors to catch up with lost learning time during the pandemic.


Figure 1. Among adults 18 years old and over who had children under age 18 in the home enrolled in school, percentage reporting participation in summer education activities after the end of the normal school year in spring of 2021, by type of summer activity: September 15 to 27, 2021

Bar chart showing percentage of adults 18 years old and over who had children under age 18 in the home enrolled in school reporting participation in summer education activities after the end of the normal school year in Spring of 2021, by type of summer activity, from the September 15 to 27, 2021, phase of the Household Pulse Survey

1 Does not equal the total of the subcategories because respondents could report multiple types of summer education activities.
NOTE: Data in this figure are considered experimental and do not meet NCES standards for response rates. The 2021 Household Pulse Survey, an experimental data product, is an Interagency Federal Statistical Rapid Response Survey to Measure Household Experiences during the coronavirus pandemic, conducted by the U.S. Census Bureau in partnership with 16 other federal agencies and offices. The number of respondents and response rate for the period reported in this table were 59,833 and 5.6 percent. The final weights are designed to produce estimates for the total persons age 18 and older living within housing units. These weights were created by adjusting the household level sampling base weights by various factors to account for nonresponse, adults per household, and coverage. For more information, see https://www.census.gov/programs-surveys/household-pulse-survey/technical-documentation.html. Although rounded numbers are displayed, the figures are based on unrounded data.  
SOURCE: U.S. Department of Commerce, Census Bureau, Household Pulse Survey, September 15 to 27, 2021. See Digest of Education Statistics 2021, table 227.60.


There were no significant differences in the overall percentage of adults reporting any summer education activities for their children by school type (public school, private school, or homeschooled). However, there were differences in the most common type of summer education activity reported for those with children in public school versus private school. Among adults with children in public school, the most reported summer activity was attending a summer school program to catch up with lost learning during the pandemic (11 percent) (figure 2). Among adults with children in private school, higher percentages reported children attended school-led summer camps for subjects like math, science, or reading or worked with private tutors to catch up with lost learning time during the pandemic (11 percent, each), compared with the percentage who reported children attended a traditional summer school program because of poor grades (3 percent). There were no significant differences among adults with homeschooled children by type of summer education activity.


Figure 2. Among adults 18 years old and over who had children under age 18 in the home enrolled in school, percentage reporting participation in summer education activities after the end of the normal school year in spring of 2021, by control of school and type of summer activity: September 15 to 27, 2021

Bar chart showing percentage of adults 18 years old and over who had children under age 18 in the home enrolled in school reporting participation in summer education activities after the end of the normal school year in Spring of 2021, by control of school and type of summer activity, from the September 15 to 27, 2021, phase of the Household Pulse Survey

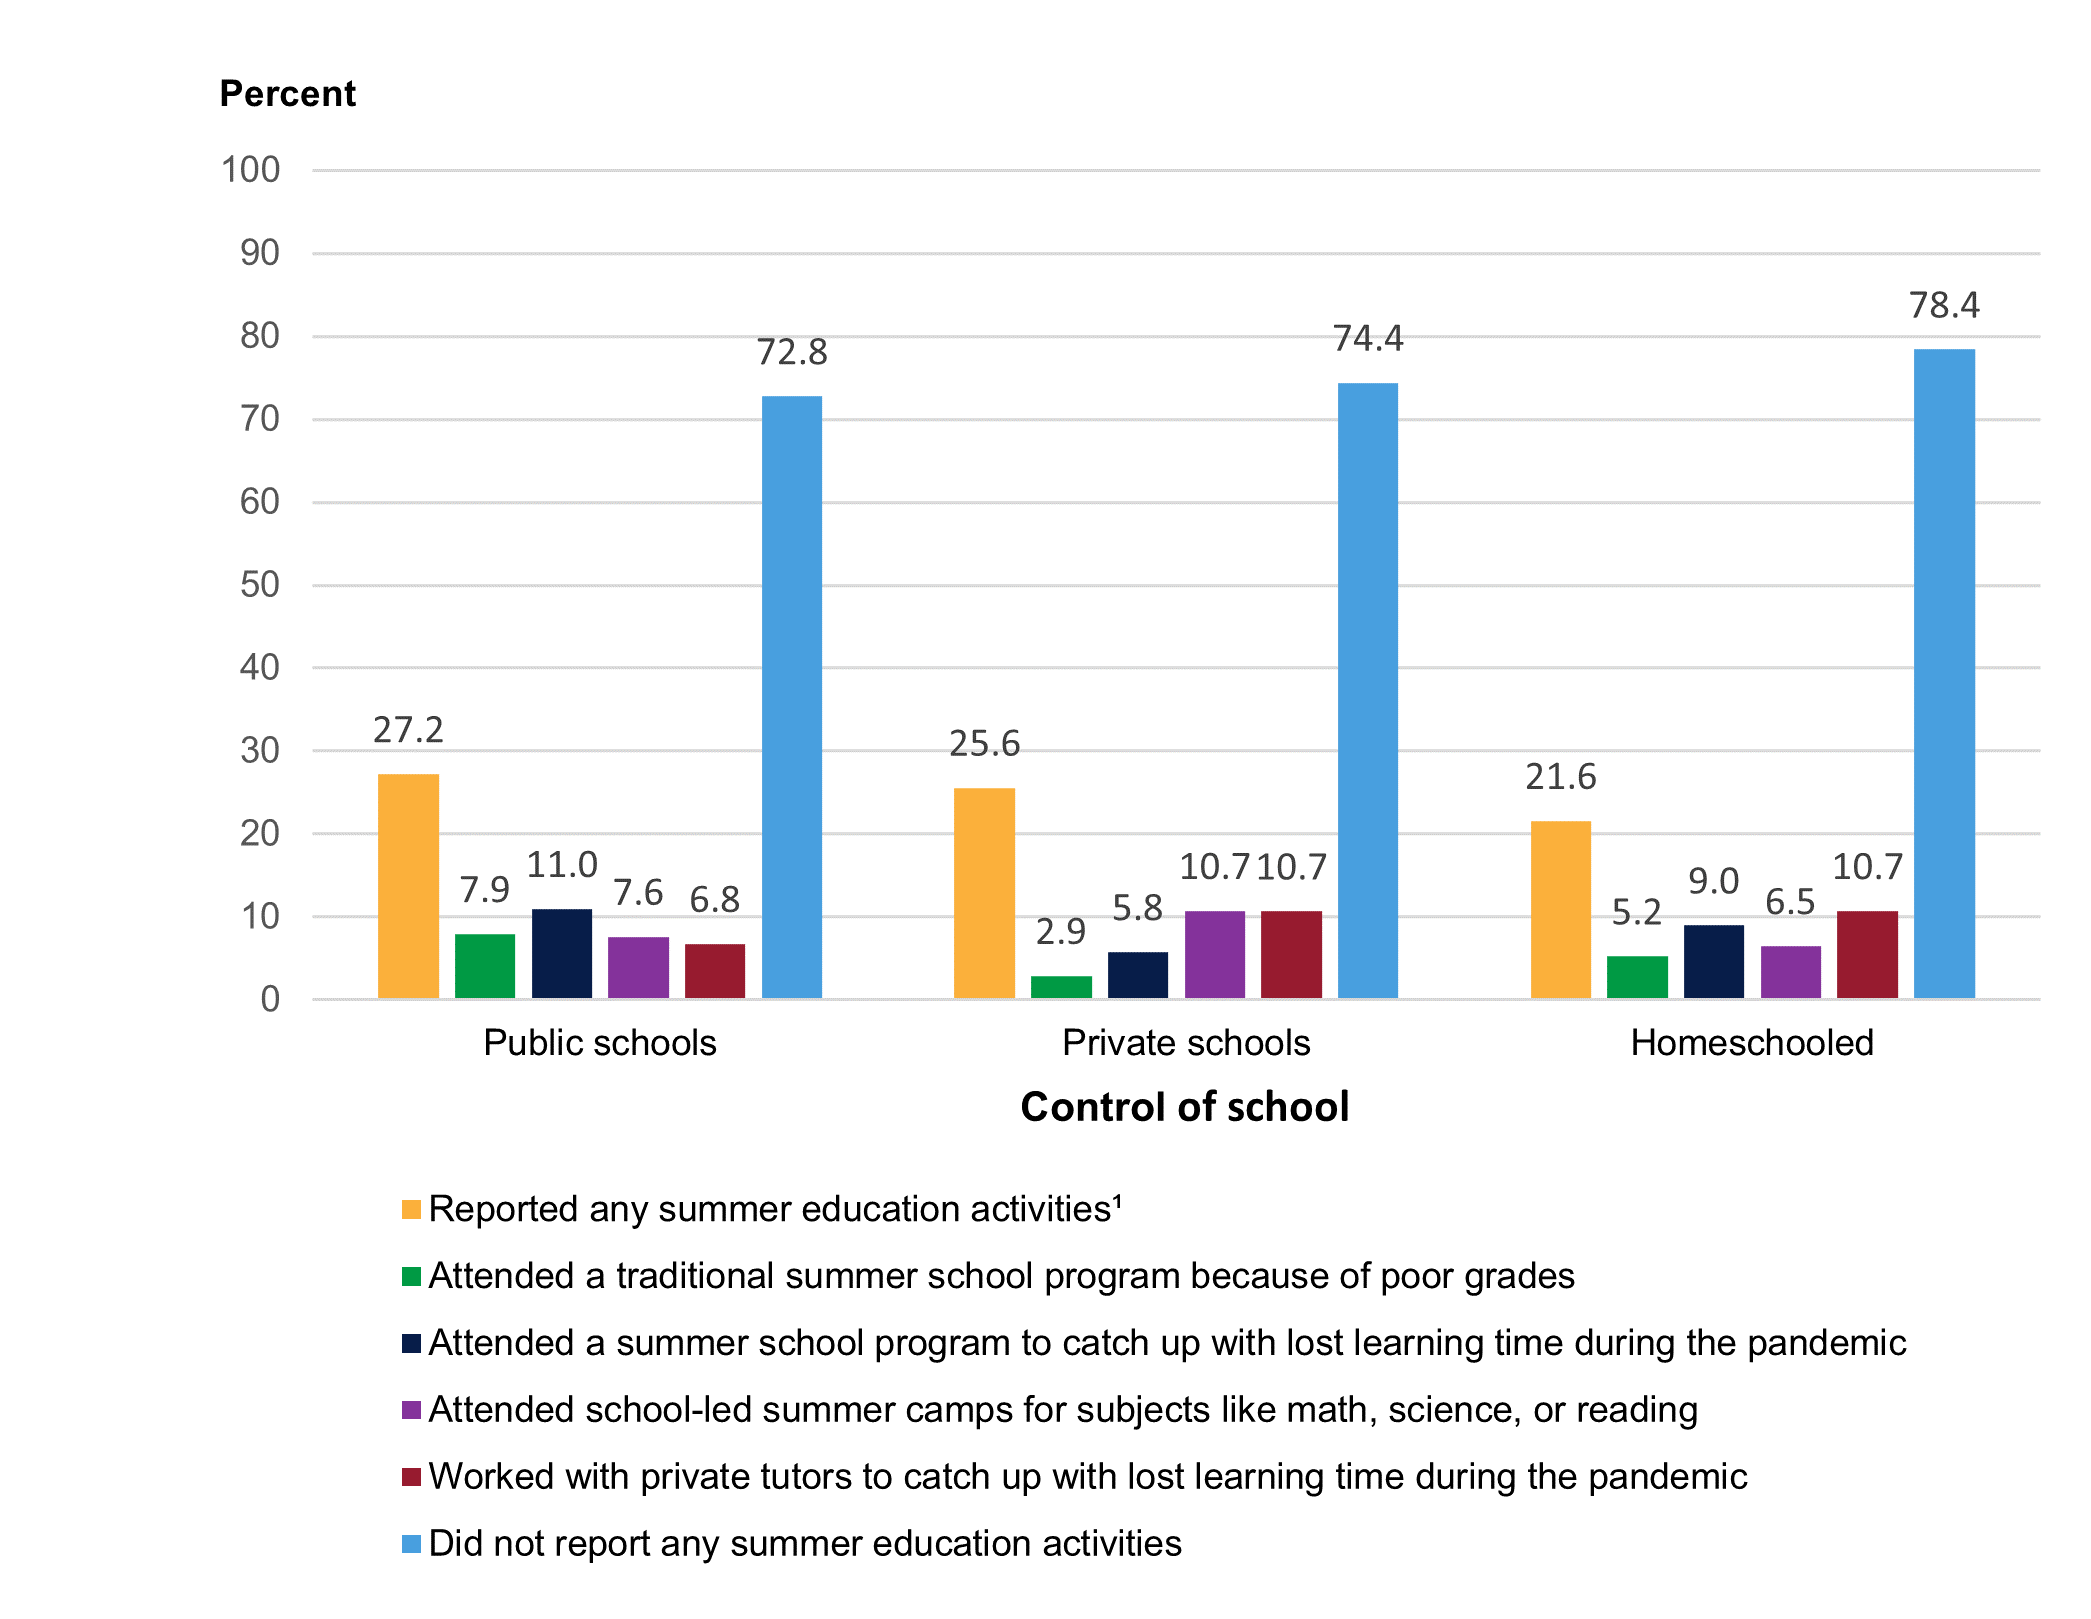
NOTE: Figure excludes percentage of adults reporting any summer education activities for their children or that their children did not participate in any summer activities. Data in this figure are considered experimental and do not meet NCES standards for response rates. The 2021 Household Pulse Survey, an experimental data product, is an Interagency Federal Statistical Rapid Response Survey to Measure Household Experiences during the coronavirus pandemic, conducted by the U.S. Census Bureau in partnership with 16 other federal agencies and offices. The number of respondents and response rate for the period reported in this table were 59,833 and 5.6 percent. The final weights are designed to produce estimates for the total persons age 18 and older living within housing units. These weights were created by adjusting the household level sampling base weights by various factors to account for nonresponse, adults per household, and coverage. For more information, see https://www.census.gov/programs-surveys/household-pulse-survey/technical-documentation.html. Although rounded numbers are displayed, the figures are based on unrounded data.
SOURCE: U.S. Department of Commerce, Census Bureau, Household Pulse Survey, September 15 to 27, 2021. See Digest of Education Statistics 2021, table 227.60.


Children’s participation in any summer education activities in the summer of 2021 varied across racial/ethnic groups. The percentage of adults reporting any summer activities for their children was higher for Black adults (44 percent) than for all other racial/ethnic groups (figure 3). While lower than the percentage of Black adults reporting any summer activities for their children, the percentages of Asian and Hispanic adults (33 and 32 percent, respectively) were both higher than the percentage of White adults (20 percent).


Figure 3. Among adults 18 years old and over who had children under age 18 in the home enrolled in school, percentage reporting participation in any summer education activities after the end of the normal school year in spring of 2021, by adult’s race/ethnicity: September 15 to 27, 2021

Bar chart showing percentage of adults 18 years old and over who had children under age 18 in the home enrolled in school reporting participation in summer education activities after the end of the normal school year in Spring of 2021, by adult’s race/ethnicity, from the September 15 to 27, 2021, phase of the Household Pulse Survey

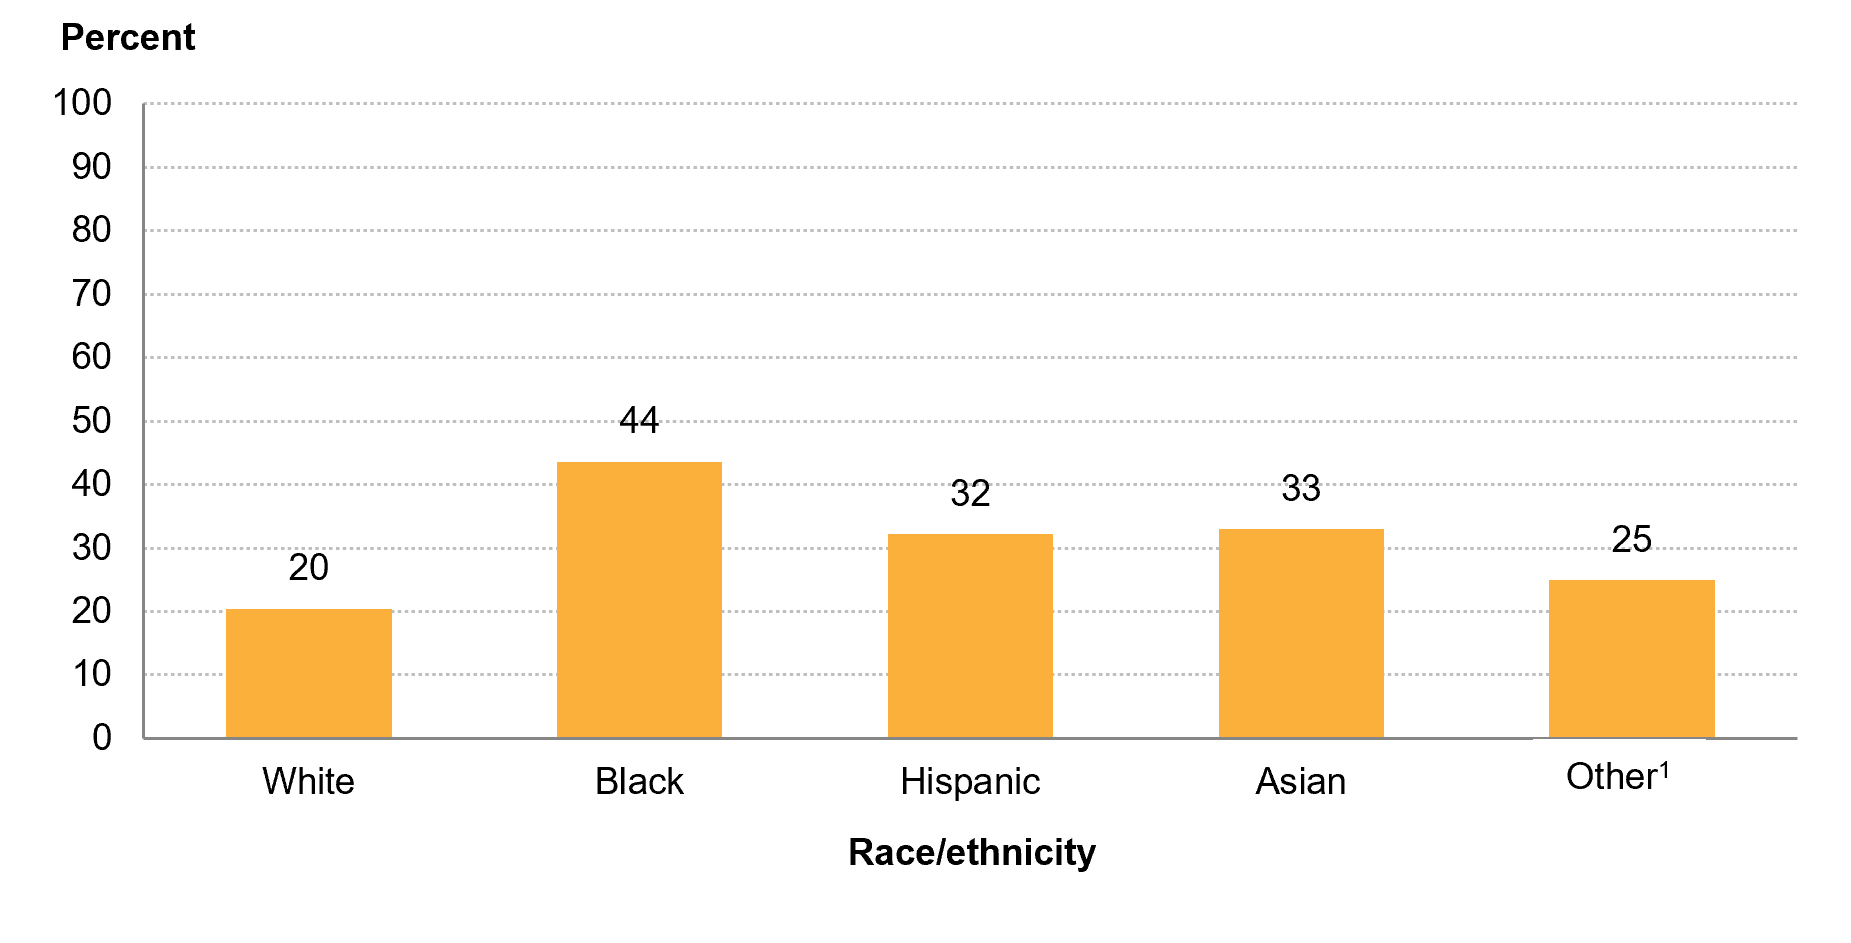
1 Includes persons reporting Pacific Islander alone, persons reporting American Indian/Alaska Native alone, and persons of Two or more races.
NOTE: Data in this figure are considered experimental and do not meet NCES standards for response rates. The 2021 Household Pulse Survey, an experimental data product, is an Interagency Federal Statistical Rapid Response Survey to Measure Household Experiences during the coronavirus pandemic, conducted by the U.S. Census Bureau in partnership with 16 other federal agencies and offices. The number of respondents and response rate for the period reported in this table were 59,833 and 5.6 percent. The final weights are designed to produce estimates for the total persons age 18 and older living within housing units. These weights were created by adjusting the household level sampling base weights by various factors to account for nonresponse, adults per household, and coverage. For more information, see https://www.census.gov/programs-surveys/household-pulse-survey/technical-documentation.html. Race categories exclude persons of Hispanic ethnicity.
SOURCE: U.S. Department of Commerce, Census Bureau, Household Pulse Survey, September 15 to 27, 2021. See Digest of Education Statistics 2021, table 227.60.            


There were also some differences observed in reported participation rates in summer education activities by the responding adult’s highest level of educational attainment. Children in households where the responding adult had completed less than high school were more likely to participate in summer education activities (39 percent) than were those in households where the responding adult had completed some college or an associate’s degree (25 percent), a bachelor’s degree (22 percent), or a graduate degree (25 percent) (figure 4). Similarly, children in households where the responding adult had completed high school2 were more likely to participate in summer education activities (28 percent) than were those in households where the responding adult had completed a bachelor’s degree (22 percent). There were no significant differences in children’s participation rates between other adult educational attainment levels.


Figure 4. Among adults 18 years old and over who had children under age 18 in the home enrolled in school, percentage reporting participation in any summer education activities after the end of the normal school year in spring of 2021, by adult’s highest level of educational attainment: September 15 to 27, 2021

Bar chart showing percentage of adults 18 years old and over who had children under age 18 in the home enrolled in school reporting participation in summer education activities after the end of the normal school year in Spring of 2021, by adult’s highest level of educational attainment, from the September 15 to 27, 2021, phase of the Household Pulse Survey

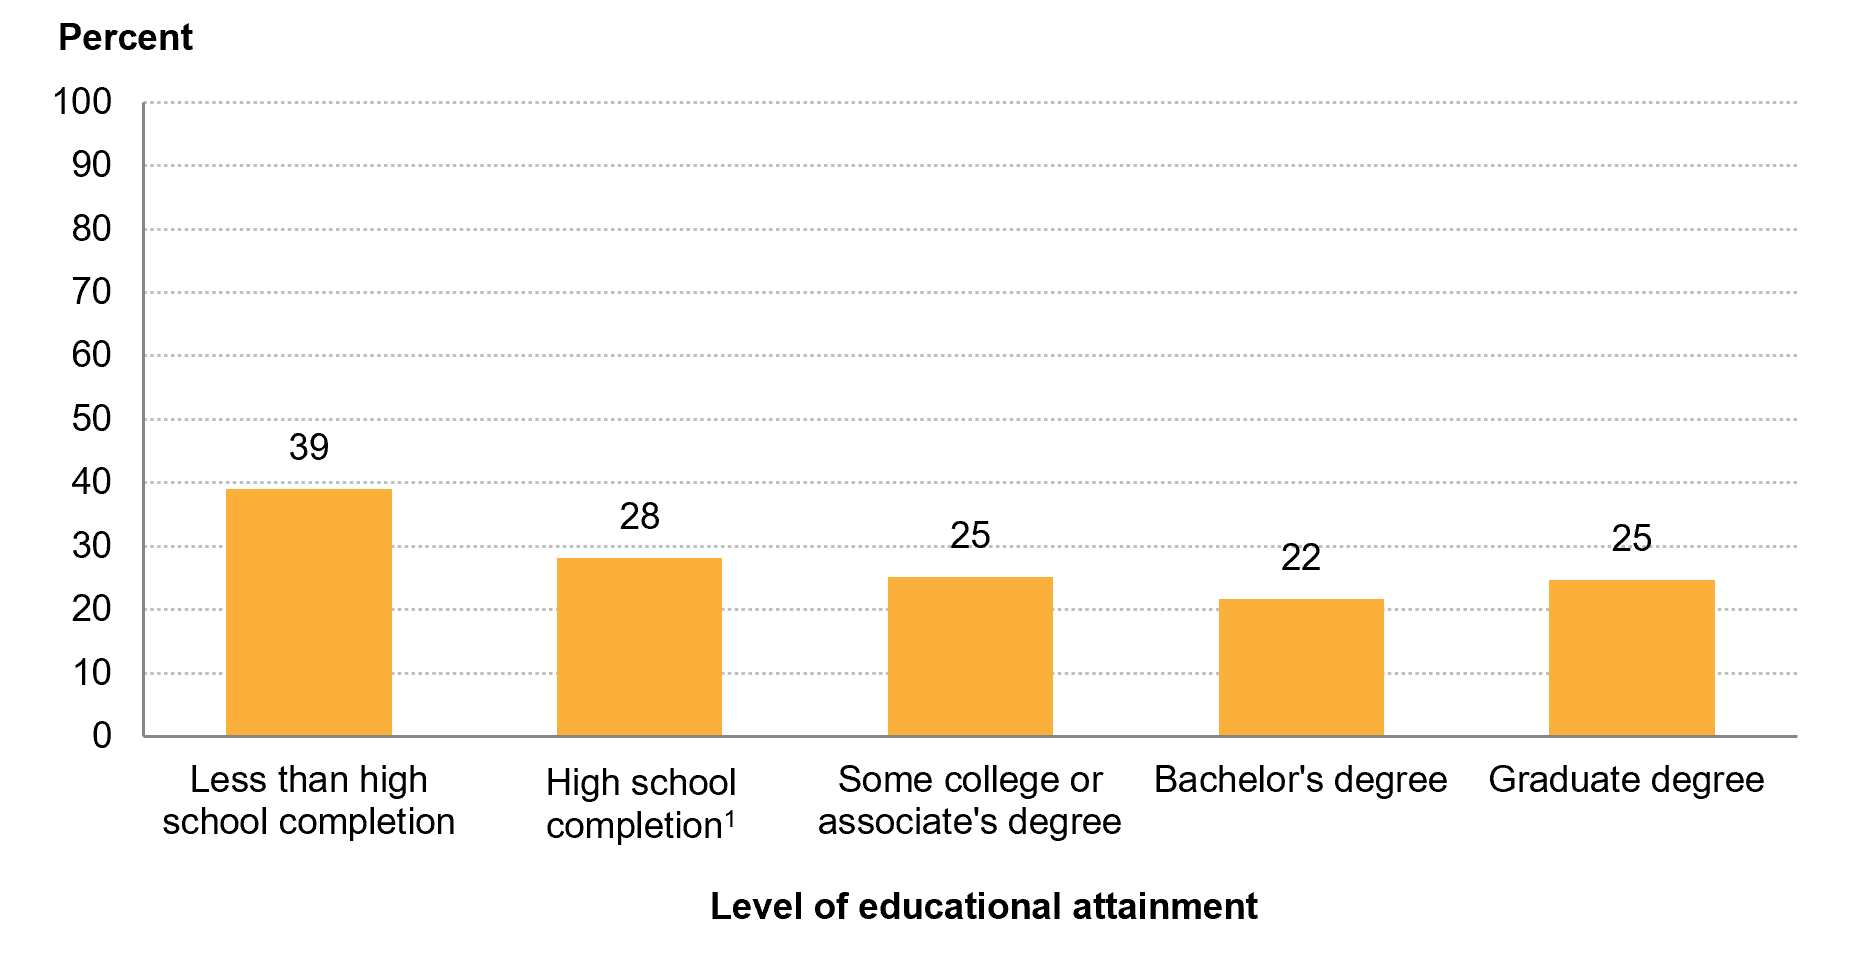
1 High school completers include those with a high school diploma as well as those with an alternative credential, such as a GED.
NOTE: Data in this figure are considered experimental and do not meet NCES standards for response rates. The 2021 Household Pulse Survey, an experimental data product, is an Interagency Federal Statistical Rapid Response Survey to Measure Household Experiences during the coronavirus pandemic, conducted by the U.S. Census Bureau in partnership with 16 other federal agencies and offices. The number of respondents and response rate for the period reported in this table were 59,833 and 5.6 percent. The final weights are designed to produce estimates for the total persons age 18 and older living within housing units. These weights were created by adjusting the household level sampling base weights by various factors to account for nonresponse, adults per household, and coverage. For more information, see https://www.census.gov/programs-surveys/household-pulse-survey/technical-documentation.html. Although rounded numbers are displayed, the figures are based on unrounded data.  
SOURCE: U.S. Department of Commerce, Census Bureau, Household Pulse Survey, September 15 to 27, 2021. See Digest of Education Statistics 2021, table 227.60


The percentage of adults reporting that children participated in summer education activities also varied across households with different levels of income in 2020. The percentages of adults reporting that children participated in any summer education activities were higher for those with a 2020 household income of less than $25,000 (34 percent) and $25,000 to $49,999 (33 percent) than for all other higher household income levels. There were no significant differences in reported participation rates among adults with 2020 household income levels of $50,000 to $74,999, $75,000 to $99,999, $100,000 to $149,999, and $150,000 or more.

Learn more about the Household Pulse Survey and access data tables, public use files, and an interactive data tool. For more detailed data on the summer education activities discussed in this blog post, explore the Digest of Education Statistics, table 227.60. To access other data on how the COVID-19 pandemic has impacted education, explore our School Pulse Panel dashboard.

Be sure to follow us on Twitter, Facebook, LinkedIn, and YouTube to stay up-to-date on the latest findings and trends in education, including those on summer learning activities.


By Ashley Roberts, AIR


[1] The speed of the survey development and the pace of the data collection efforts led to policies and procedures for the experimental HPS that were not always consistent with traditional federal survey operations. For example, the timeline for the surveys meant that opportunities to follow up with nonrespondents were very limited. This has led to response rates of 1 to 10 percent, which are much lower than the typical target response rate set in most federal surveys. While the responses have been statistically adjusted so that they represent the nation and states in terms of geographic distribution, sex, race/ethnicity, age, and educational attainment, the impact of survey bias has not been fully explored.

[2] High school completers include those with a high school diploma as well as those with an alternative credential, such as a GED.

Access an NCES Presentation on ECLS Reading Data From the IES Reading Summit

NCES staff presented information on reading data from the Early Childhood Longitudinal Studies (ECLS) Program at the June 2021 Institute of Education Sciences (IES)/Council of the Great City Schools (CGCS) Reading Summit. The ECLS data cover a wide range of reading-related topics, such as children’s reading knowledge and skills, home literacy activities, and teachers’ instructional practices. The presentation included a brief overview of three ECLS program studies and the reading-related data collected by each. In addition, the presentation included a discussion of the resources available to either see what research has been conducted with the data or explore the data independently. As the focus of the presentation was on data available to the public for secondary analysis, its target audience was researchers and others with a data science focus.

Access the Reading Summit presentation—Reading Data Available from the Early Childhood Longitudinal Studies (ECLS)—and handout below to learn more about ECLS reading data.

Be sure to also check out this blog post to learn more about the work highlighted at the IES Reading Summit.


By Jill Carlivati McCarroll, NCES

Changes in Pupil/Teacher Ratios in 2020: Impacts of the COVID-19 Pandemic

The COVID-19 pandemic has brought enormous challenges to the education system, including a historic decline in enrollment in fall 2020—the largest since during World War II. Due to the relatively small decrease in the number of teachers, there was a significant drop in the pupil/teacher ratio.  

The National Center for Education Statistics (NCES) releases key statistics, including school staffing data, compiled from state administrative records through the Common Core of Data (CCD). In 2019, about 48 percent of public school staff were teachers (3.2 million) and 13 percent were instructional aides (0.9 million). NCES’s new School Pulse Panel survey found that in January 2022, about 61 percent of public schools with at least one vacancy reported that the pandemic increased the number of teacher and staff vacancies, and 57 percent of schools with at least one vacancy found that the pandemic forced them to use teachers outside their normal duty areas.

Pupil/teacher ratios provide a measure of the quantity of instructional resources available to students by comparing the number of students with the total full-time equivalent (FTE) of all teachers, including special education teachers. The public and private elementary and secondary average class size is larger than the pupil/teacher ratio since it normally does not factor into team teaching, specialty teachers, or special education classes. Between fall 2019 and fall 2020, enrollment in public elementary and secondary schools1 decreased by 2.7 percent.2 This decrease was larger than the 0.2 percent (6,700)3 decrease in the number of public school teachers. Since fall 2020, public school enrollment decreased by a larger amount than did the number of teachers. Thus, the pupil/teacher ratio declined in school year 2020–21 by a relatively large 0.5 pupils per teacher, from 15.9 to 15.4 pupils per teacher (figure 1). This is the largest 1-year decrease in more than 4 decades. In comparison, the pupil/teacher ratio for private schools was 11.4 in 2019–20 (the latest year of actual data available). It is worth noting that pupil/teacher ratios vary across schools with different characteristics (table 208.10).

Viewed over a longer term, the pupil/teacher ratio in public schools in 2019–20 (15.9) was only slightly lower than in 2010–11 (16.0), so nearly all the change during the 2010–11 to 2020–21 period occurred in the last year. The pupil/teacher ratio for private schools decreased from 12.5 in 2010–11 to 11.4 in 2019–20.


Figure 1. Pupil/teacher ratio in public and private elementary and secondary schools: 2010–11 to 2020–21

Line graph showing pupil/teacher ratio in public and private elementary and secondary schools from 2010–11 to 2020–21

NOTE: Data in this figure represent the 50 states and the District of Columbia. Data for teachers are expressed in full-time equivalents (FTE). Counts of private school enrollment include prekindergarten through grade 12 in schools offering kindergarten or higher grades. Counts of private school teachers exclude teachers who teach only prekindergarten students. Counts of public school teachers and enrollment include prekindergarten through grade 12. The pupil/teacher ratio includes teachers for students with disabilities and other special teachers, while these teachers are generally excluded from class size calculations. Ratios for public schools reflect totals reported by states and differ from totals reported for schools or school districts.  The school year 2020–21 pupil/teacher ratio shown in this figure includes only states which reported both membership and FTE teacher counts for SY 2020–21.

SOURCE: U.S. Department of Education, National Center for Education Statistics, Digest of Education Statistics 2021, table 208.20; Common Core of Data, table 2.


The declines in pupil/teacher ratios in public schools were not consistent across states between 2019–20 and 2020–21 (figure 2). The relatively large enrollment decreases in many states—along with the smaller decreases or even increases in the number of teachers in fall 2020—led to decreases in the pupil/teacher ratios for most states. Three states (Nevada, Florida, and Ohio) reported increases in their pupil/teacher ratios, and the rest of the states reporting data had decreases in their pupil/teacher ratios. The states with the largest decreases in their pupil/teacher ratios were Indiana (-1.3 pupils per teacher), Arizona (-1.1 pupils per teacher), Kansas (-0.9 pupils per teacher), and Kentucky (-0.9 pupils per teacher).4


Figure 2. Change in pupil/teacher ratios in public elementary and secondary schools, by state: 2019–20 to 2020–21

Map of United States showing increases and decreases in pupil/teacher ratios in public elementary and secondary schools from 2019–20 to 2020–21

NOTE: Data for Illinois and Utah are not available.

SOURCE: U.S. Department of Education, National Center for Education Statistics, Common Core of Data (CCD), “State Nonfiscal Public Elementary/Secondary Education Survey,” 2019–20 v.1a, table 2, and 2020–21 v.1a, table 2.


By Tom Snyder, AIR


[1] Counts of public school teachers and enrollment include prekindergarten through grade 12.

[2] Enrollment data are for fall of the school year while pupil/teacher ratios are based on school years.

[3] Includes imputed teacher FTE data for Illinois and Utah.

[4] Although Oregon had a 2 pupil per teacher decrease based on the Summary Table 2 for 2019–20 and 2020–21, Oregon did not submit prekindergarten data for 2020–21, so the ratios were not comparable.

NCES Activities Dedicated to Understanding the Condition of Education During the Coronavirus Pandemic

The emergence of the coronavirus pandemic 2 years ago shifted not only how students received educational services around the world but also how the National Center for Education Statistics (NCES) carried out its mission, which is to collect, analyze, and report statistics on the condition of education in the United States.

NCES has conducted several surveys to measure educational enrollment, experiences, and outcomes as part of existing data collections and created new, innovative, and timely data initiatives. NCES is currently fielding more than 15 projects with information related to the pandemic. Since early 2020, NCES has collected information about educational experiences of students from elementary through postsecondary institutions. A few of the data collections will extend beyond 2022, providing rich data resources that will document changes in the educational landscape throughout the lifecycle of the pandemic.


NCES Coronavirus Pandemic Data Collection Coverage


In order to respond to the call for information about how students learned during widespread school disruptions, NCES modified existing and created new data collection avenues to receive and report vital information in unprecedented ways. Below are summaries of some of the data products available.

Looking ahead, NCES will provide NAEP data on how student performance has changed in various subjects since the coronavirus pandemic began. NCES will also collect and report information about learning contexts, which are critical for understanding educational outcomes. NCES will also develop a new system to share pandemic-related data collected across the center.

All of these resources are currently available or will be available on the NCES website.


By Ebony Walton and Josh DeLaRosa, NCES