IES Blog

Institute of Education Sciences

Creating a Community of Writers

The Predoctoral Interdisciplinary Research Training Program in the Education Sciences was established by IES to increase the number of well-trained PhD students who are prepared to conduct rigorous and relevant education research. IES encourages our predoctoral fellows to develop strong writing skills in addition to subject-matter and methodological expertise. In this guest blog, we asked IES predoctoral fellow, Todd Hall, co-chair of the Black Scholars in Education and Human Development Writing Group at the University of Virginia, to discuss how participating in this writing group has helped his development as an education researcher. Todd, is part of the IES-funded Virginia Education Science Training (VEST) program and studies early childhood education policy as well as school discipline in both early childhood and K-12 settings.

How did you become involved in the Black Scholars in Education and Human Development Writing Group?

I started my PhD in education policy in August 2020. The COVID-19 pandemic made networking and simply making friends awkward. During my first week in Charlottesville, VA, I watched wistfully from my window as a Black person jogged past my house. For me, the jogger represented communities of color at UVA that I did not know how to connect with.

Enter Dr. Edward Scott and Dr. Miray Seward, then students and co-chairs of the Black Scholars in Education and Human Development Writing Group. They sent me a personal email invitation to join the group’s first virtual writing retreat. When I joined the Zoom room, I found the affinity space I was looking for. I connected with graduate students whom I later turned to for informal mentorship, course recommendations, tips on navigating the hidden curriculum of grad school, insights from job market experiences, and examples of successful written proposals. The laughs shared virtually during check-ins between writing blocks helped ward off the pandemic blues.

I resolved to pay it forward, so I began shadowing Edward and Miray. When they graduated, I stepped into a leadership role alongside my co-chair, Sasha Miller-Marshall.

How has participating in the writing group helped you develop as a scholar?

The writing group has reminded me that I am not the only one who experiences writer’s block and has provided me with writing process role models. The professional development sessions we host have been one of the few opportunities that I have found to see faculty expose and reflect on their own writing challenges, from protecting their time for writing to incorporating critical feedback. This provides a unique perspective on the writing process—I often see faculty discuss works in progress, but the format is usually an oral presentation with slides rather than something written.

In the Black Scholars Writing Group sessions, speakers often share candidly about their own process, including writer’s block and how they overcome it. For example, a senior faculty member shared that they used voice memos to process their thoughts when they feel stuck. That disclosure normalized my experience of writer’s block and made me feel comfortable sharing that I write memos on my phone when I feel stuck. Moments like these have provided tools to overcome resistance in my writing process and normalized the experience of strategizing about writing rather than expecting words to flow effortlessly.

The presenters who lead sessions with our group have diverse racial/ethnic backgrounds, but the focus of the group on creating affinity space for Black doctoral and PhD students allows me to be less concerned about stereotype threat. Whereas I am often the only Black person in other rooms, I am never the only Black person in this writing group. That alleviates any concern about being perceived as a token representative of Black people, or worse, as less capable if I choose to share my difficulties. In one session, I was able to unpack with the faculty speaker that a particular piece of writing was difficult because I had not yet answered the simple question of why the work was important. I got to that realization because the speaker modeled vulnerability about their own writing process, and I felt at ease to discuss my own.

How can the broader education research community help graduate student researchers develop as writers?

Where appropriate and feasible, education researchers can share their successful conference proposals, grant applications, budgets, reviewer response letters, and perhaps even dissertation chapters. If it does not make sense to post them publicly, researchers could offer to share materials with graduate students that they meet at speaking engagements, conferences, etc.

Successful models have given me helpful guidance, especially when tackling a new format. Beyond the writing group, I am immensely grateful to the alumni of my IES pre-doctoral fellowship who have provided many of their materials for current students to reference.

What advice can you give other student researchers who wish to further develop their writing skills?

Cultivate authentic relationships with a network of mentors who are willing to share examples of their successful writing and review your work. My advisor is amazing and thorough with her feedback. That said, it has been useful to strategically ask others who bring in complementary perspectives to review my work. For example, my advisor is a quantitative researcher, and I recently proposed a mixed methods study. Researchers who do qualitative and mixed methods work were able to challenge and strengthen the qualitative aspects of my proposal based on their expertise. You might also be applying for opportunities or submitting to journals that other mentors have succeeded with or reviewed for. They may help you anticipate what that audience might be looking for.

In addition, when you receive feedback, do so graciously, weigh it seriously, and ask yourself if there’s a broader piece of constructive criticism to apply to your other writing.


This blog was produced training program officer Katina Stapleton (Katina.Stapleton@ed.gov) and is part of a larger series on the IES research training programs.

Experimenting with Science Education to Improve Learner Opportunities and Outcomes

The NAEP science assessment measures science knowledge and ability to engage in scientific inquiry and conduct scientific investigations. According to results from the 2019 NAEP science assessment, only one-third of grade 4 and grade 8 students, and less than one-quarter of grade 12 students scored at or above proficient. In addition, for grade 4 middle-performing and low-performing students, their science performance showed declines from 2015. While IES has a history of investing in high quality science education research to improve science teaching and learning, these data suggest that much more work is needed.

To that end, during the 2022-23 school year, IES held two Learning Acceleration Challenges designed to incentivize innovation to significantly improve learner outcomes in math and science. Under the Challenge for the Science Prize, IES sought interventions to significantly improve science outcomes for middle school students with low performance in science. Unfortunately, the judging panel for the Challenge did not recommend any finalists for the Science Prize (more information about the Math Prize results can be found here). IES recognized this Challenge was an ambitious and rapid effort to improve science achievement. Feedback from potential Science Prize entrants indicated that the rapid cycle for evaluating the intervention along with the lack of resources to implement the intervention were barriers to this competition.

With the knowledge gained from the Science Prize, IES is continuing to design opportunities that encourage transformative, innovative change to improve teaching and learning in science. In our newest opportunity, the National Center for Education Research (NCER) at IES, in partnership with the National Science Foundation (NSF), released a Request for Applications for a National Research and Development Center (R&D Center) on Improving Outcomes in Elementary Science Education. Results from the most recent NAEP science assessment and the lessons learned from the Science Prize suggest opportunities for improving teaching and learning in science education need to begin early in education, and more resources are needed to conduct high quality research in science education. Through this R&D Center, IES and NSF will provide greater resources (grant award of up to $15 million over 5 years) to tackle persistent challenges in elementary science education, including the measurement of elementary science learning outcomes, and generating evidence of the impact of elementary science interventions on learner’s science achievement. In doing so, the new Elementary Science R&D Center will provide national leadership on elementary science education and build capacity in conducting high-quality science education research.


This blog was written by NCER program officer, Christina Chhin. For more information about the Elementary Science R&D Center competition, contact NCER program officers, Jennifer Schellinger or Christina Chhin, take a look at the 84.305C RFA, and/or attend one of our virtual office hours.

NCES Presentation at National HBCU Week Conference

In NCES’s recently released Strategic Plan, Goal 3 identifies our commitment to foster and leverage beneficial partnerships. To fulfill that goal, NCES participates in multiple conferences and meetings throughout the year. Recently, NCES participated in the National Historically Black Colleges and Universities (HBCU) Week Conference. NCES’s presentation at this conference helps us to establish a dialogue with HBCUs and develop partnerships to address critical issues in education.

NCES Commissioner Peggy G. Carr kicked off the presentation with an overview of HBCU data—such as student characteristics, enrollment, and financial aid. Then, NCES experts explored how data from various NCES surveys can help researchers, educators, and policymakers better understand the condition and progress of HBCUs. Read on to learn about these surveys.


Integrated Postsecondary Education Data System (IPEDS)

The Integrated Postsecondary Education Data System (IPEDS) is an annual administrative data collection that gathers information from more than 6,000 postsecondary institutions, including 99 degree-granting, Title IV–eligible HBCUs (in the 2021–22 academic year).

The data collected in IPEDS includes information on institutional characteristics and resources; admissions and completions; student enrollment; student financial aid; and human resources (i.e., staff characteristics). These data are disaggregated, offering insights into student and employee demographics by race/ethnicity and gender, students’ age categories, first-time/non-first-time enrollment statuses, and full-time/part-time attendance intensity.

Data from IPEDS can be explored using various data tools—such as Data Explorer, Trend Generator, and College Navigator—that cater to users with varying levels of data knowledge and varying data needs.


National Postsecondary Student Aid Study (NPSAS)

The National Postsecondary Student Aid Study (NPSAS) is a nationally representative study that examines the characteristics of students in postsecondary institutions—including HBCUs—with a special focus on how they finance their education. NPSAS collects data on the percentage of HBCU students receiving financial aid and the average amounts received from various sources (i.e., federal, state, and institution) by gender and race/ethnicity.

Conducted every 3 or 4 years, this study combines data from student surveys, student-level school records, and other administrative sources and is designed to describe the federal government’s investment in financing students’ postsecondary education.

Data from NPSAS can be explored using DataLab and PowerStats.


National Teacher and Principal Survey (NTPS)

The National Teacher and Principal Survey (NTPS) is the U.S. Department of Education’s primary source of information on K–12 public and private schools from the perspectives of teachers and administrators. NTPS consists of coordinated surveys of schools, principals, and teachers and includes follow-up surveys to study principal and teacher attrition.

Among many other topics, NTPS collects data on the race/ethnicity of teachers and principals. These data—which show that Black teachers and principals make up a relatively small portion of the K–12 workforce—can be used to explore the demographics and experiences of teachers and principals. NTPS provides postsecondary institutions, like HBCUs, a snapshot of the preK–12 experiences of students and staff.

Data from NTPS can be explored using DataLab and PowerStats.


National Assessment of Educational Progress (NAEP)

The National Assessment of Educational Progress (NAEP)—also known as the Nation’s Report Card—is the the largest nationally representative and continuing assessment of what students in public and private schools in the United States know and are able to do in various subjects.

Main NAEP assesses students in grades 4, 8, and 12 in subjects like reading, mathematics, science, and civics, while NAEP Long-Term Trend assesses 9-, 13-, and 17-year-olds in reading and mathematics.

Among many other topics, NAEP collects data on students by race/ethnicity. These data can help to shed light on students’ experiences, academic performance, and level of preparedness before they enroll in HBCUs.

Data from NAEP can be explored using the NAEP Data Explorer.


To explore more HBCU data from these and other NCES surveys—including enrollment trends from 1976 to 2021—check out this annually updated Fast Fact. Be sure to follow NCES on X, Facebook, LinkedIn, and YouTube and subscribe to the NCES News Flash to stay up to date on the latest from NCES.


By Megan Barnett, AIR

Risk and Resilience in Children Experiencing Homelessness

In celebration of National Homeless Youth Awareness Month, Dr. Ann Masten, Regents Professor at the Institute of Child Development, University of Minnesota, reflects on her research with children in families experiencing homelessness, highlighting what inspired her, key findings, and advice for the future. Her research on homelessness has been supported by IES, NSF, NIH, her university, and local foundations. She underscores the power of a resilience lens for research with high-risk families and the vital role of research-practice partnerships.  

What inspired you to study homelessness?

In 1988, the issue of homelessness among children surged onto the front pages of newspapers and magazines as communities were confronted with rapidly growing numbers of unhoused families. That year, Jonathan Kozol published his book, Rachel and her Children: Homeless Families in America, about the desperate lives of families without homes crowded into hotels in New York City. Kozol gave a compelling talk I attended at the University of Minnesota. At the time, I was doing part-time, pro bono clinical work with children at a mental health clinic run by the Wilder Foundation. The foundation president requested that I help them learn about the needs of children and families experiencing homelessness in the Twin Cities.

Digging into the literature as I visited shelters and interviewed school personnel who were faced with the surge of family homelessness, I quickly learned that there was little information to guide educators or service providers. Shelters could barely keep track of the numbers and ages of children in residence each day, and schools were struggling to accommodate the overwhelming needs of kids in emergency shelter.

This search inspired me to launch research that might be helpful. I was deeply moved by the plight of these families who were trying to care for their children without the security of a stable home, income, food, healthcare, or emotional support. I had grown up in a military family, frequently moving and dealing with parental deployment, which was stressful even with adequate resources.

As an early career scholar, I had funding to start new work aligned with my research focus on resilience in child development. In 1989, I initiated my first study of homelessness, surveying parents and their children residing in emergency shelter compared with similar but housed families. Although I knew from the outset that homelessness was not good for children, I also realized it was important to document the risks and resilience of these families.

How has your research on homelessness evolved in the past three decades?

Initially, my research with students and community collaborators was descriptive, focused on discovering the nature of adversities children and parents had faced, variations in how well they were doing, barriers to school access, and what made a positive difference—the protective factors in their lives. Over the years, we learned that children and parents in emergency shelter had much in common with other impoverished families, although they often had faced higher cumulative risk, as well as more acute trauma, and their children had more education issues. Administrative longitudinal data provided strong evidence of academic risk among children identified as homeless, with significantly worse achievement than housed children who qualified for free lunch. Poor attendance was an issue but did not account for the striking range of academic achievement we observed. Importantly, there was ample evidence of resilience: warm, effective parents and sociable, high-achieving children, eager to play and learn.

Research on homelessness aligned with a broader story of risk and resilience in development, revealing the importance of multisystem processes and protections for children as well as the hazards of high adversity in contexts of low resources and structural inequality. Results pointed to three basic intervention strategies: (1) lowering risks and toxic stress exposure, (2) increasing resources for healthy child development, and (3) nurturing resilience at multiple levels in children, their families, schools, and communities.

Given the range of school readiness and achievement of children experiencing homelessness, we focused on malleable protective factors for school success, particularly during the preschool years. Parenting quality and executive function (EF) skills were strong candidates. We tested EF skills that reflect neurocognitive processes involved in goal-directed behavior that are vital to learning. Many of the children in shelters struggled with self-regulation and related learning skills, which predicted how well they did at school, both in the short-term and over time.  

With funding from a local foundation and IES, we developed an intervention to boost EF skills among young highly mobile children. Ready? Set. Go! (RSG) was designed to foster EF skills through practice embedded in routine preschool activities led by teachers, educating parents about brain development and how to encourage EF skills, and training parents and children with games, books, and music. Given family mobility, RSG was intended to be brief, appealing, and easy to implement. Pilot results were promising, indicating appeal to parents and teachers, fidelity of implementation, and encouraging changes in EF skills among the children.

In recent years, I have co-directed the Homework Starts with Home Research Partnership, a “grand challenge” project focused on ending student homelessness with a dedicated group of university, state, and community partners. This project integrates long-term administrative data in order to study effects of housing and other interventions on the educational success of students. Our work has underscored for me the power of collaborative partnerships and integrated data.

What advice do you have for researchers interested in conducting research on homelessness?

Connect with multisystem partners! Homelessness is a complex issue that calls for research-practice partnerships spanning multiple systems and perspectives, including lived experience.  Integrated data systems that include multisystem administrative data are particularly valuable for understanding and following mobile populations. Sign up for updates from Federal and state agencies, as well as NGOs that disseminate research updates about homelessness. And aim for positive goals! Our focus on resilience and positive outcomes as well as risks and adversity was key to engaging families and our collaborators. 


This blog was produced by Haigen Huang (Haigen.Huang@ed.gov), program officer at NCER.

Education at a Glance 2023: Putting U.S. Data in a Global Context

International comparisons provide reference points for researchers and policy analysts to understand trends and patterns in national education data and are very important as U.S. students compete in an increasingly global economy.

Education at a Glance (EAG), an annual publication produced by the Organization for Economic Cooperation and Development (OECD), provides data on the structure, finances, and progress of education systems in 38 OECD countries—including the United States—as well as a number of OECD accession and partner countries. Data presented in EAG on topics of high policy interest in the United States are also featured in NCES reports, including the Condition of Education and Digest of Education Statistics.  

The recently released 2023 edition of EAG shows that the United States is above the international average on some measures, such as funding of postsecondary education, but lags behind in others, such as participation in early childhood education and care (ECEC). The 2023 report also features a Spotlight on Vocational Education and Training as well as interactive data dashboards on ECEC systems, upper secondary education systems, and educational support for Ukrainian refugees.


Spotlight on Vocational Education and Training (VET)

Each EAG edition centers on a particular theme of high policy relevance in OECD countries. The focus of this year’s report is VET programs, which look very different in the United States compared with many other OECD countries. Unlike in many OECD countries, most high schools in the United States do not offer a separate, distinct vocational track at the upper secondary (high school) level. Instead, vocational education is available as optional career and technical education (CTE) courses throughout high school. Regardless of whether they choose to take CTE courses, all U.S. students who complete high school have the same potential to access postsecondary programs. In other OECD countries, selecting a vocational track at this level may lead to different postsecondary opportunities. Check out the 2023 EAG Spotlight for an overview of VET programs across OECD countries.


Highlights From EAG 2023

Below is a selection of topics from the EAG report highlighting how key education benchmarks in the United States compare with other OECD countries.


Postsecondary Educational Attainment

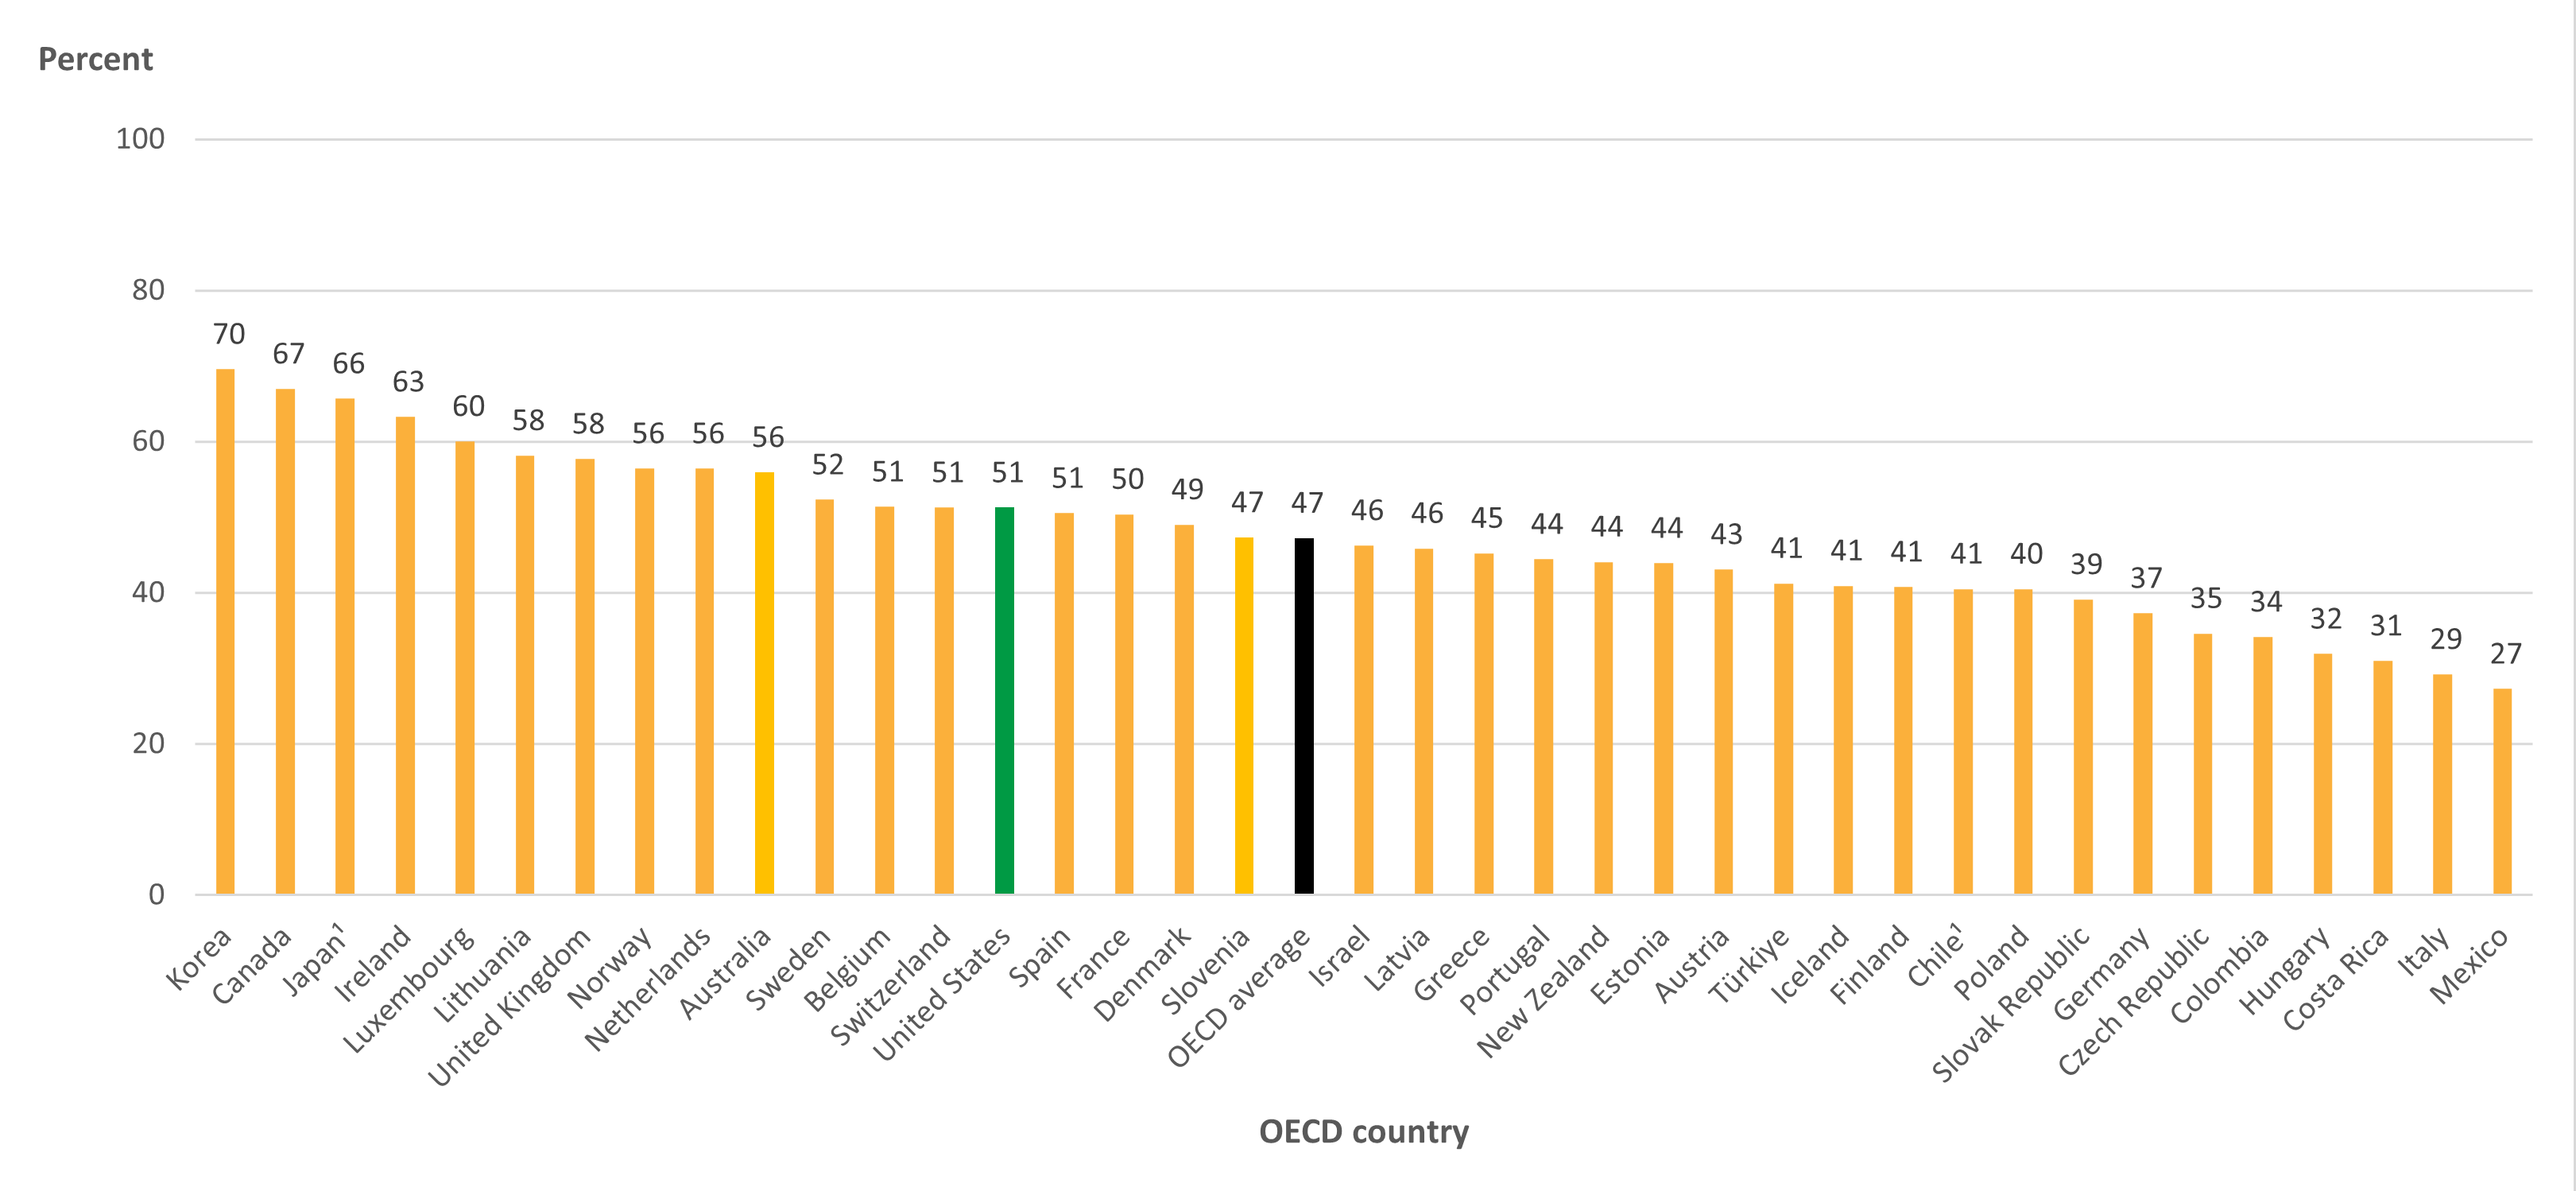
The percentage of U.S. 25- to 34-year-olds with a postsecondary degree increased by 13 percentage points between 2000 and 2022, reaching 51 percent (the OECD average in 2022 was 47 percent) (Table A1.3).1 In this age group in the United States, higher percentages of women than men attained a postsecondary degree (56 vs. 46 percent) (Table A1.2). Across OECD countries, the average postsecondary educational attainment gap between 25- to 34-year-old men and women in 2022 (13 percentage points) was wider than the gap in the United States (10 percentage points). In the United States, the postsecondary attainment rate for 25- to 34-year-old men was 5 percentage points higher than the OECD average, and the attainment rate for women was 3 percentage points higher than the OECD average.


Figure 1. Percentage of 25- to 34-year-olds with a postsecondary degree, by OECD country: 2022

[click to enlarge image]
Data include a small percentage of adults with lower levels of attainment.
Year of reference differs from 2022. Refer to the source table for more details.
SOURCE: OECD (2023), Table A1.3. See Source section for more information and Annex 3 for notes.


International Student Enrollment

The United States is the top OECD destination country for international students enrolling in postsecondary education. In 2021, some 833,204 foreign students were enrolled in postsecondary programs in the United States, representing 13 percent of the international education market share (Table B6.1).2 In comparison, the United Kingdom had the second highest number of international students enrolled in postsecondary education in 2021, representing 9 percent of the international education market share. Interestingly, when examining enrollment trends over the past 3 years (2019 to 2021), foreign student enrollment decreased by 143,649 students (15 percent) in the United States but increased by 111,570 students (23 percent) in the United Kingdom. International student enrollment during these years was likely affected by the coronavirus pandemic, which had large impacts on global travel in 2020 and 2021.


Education Spending

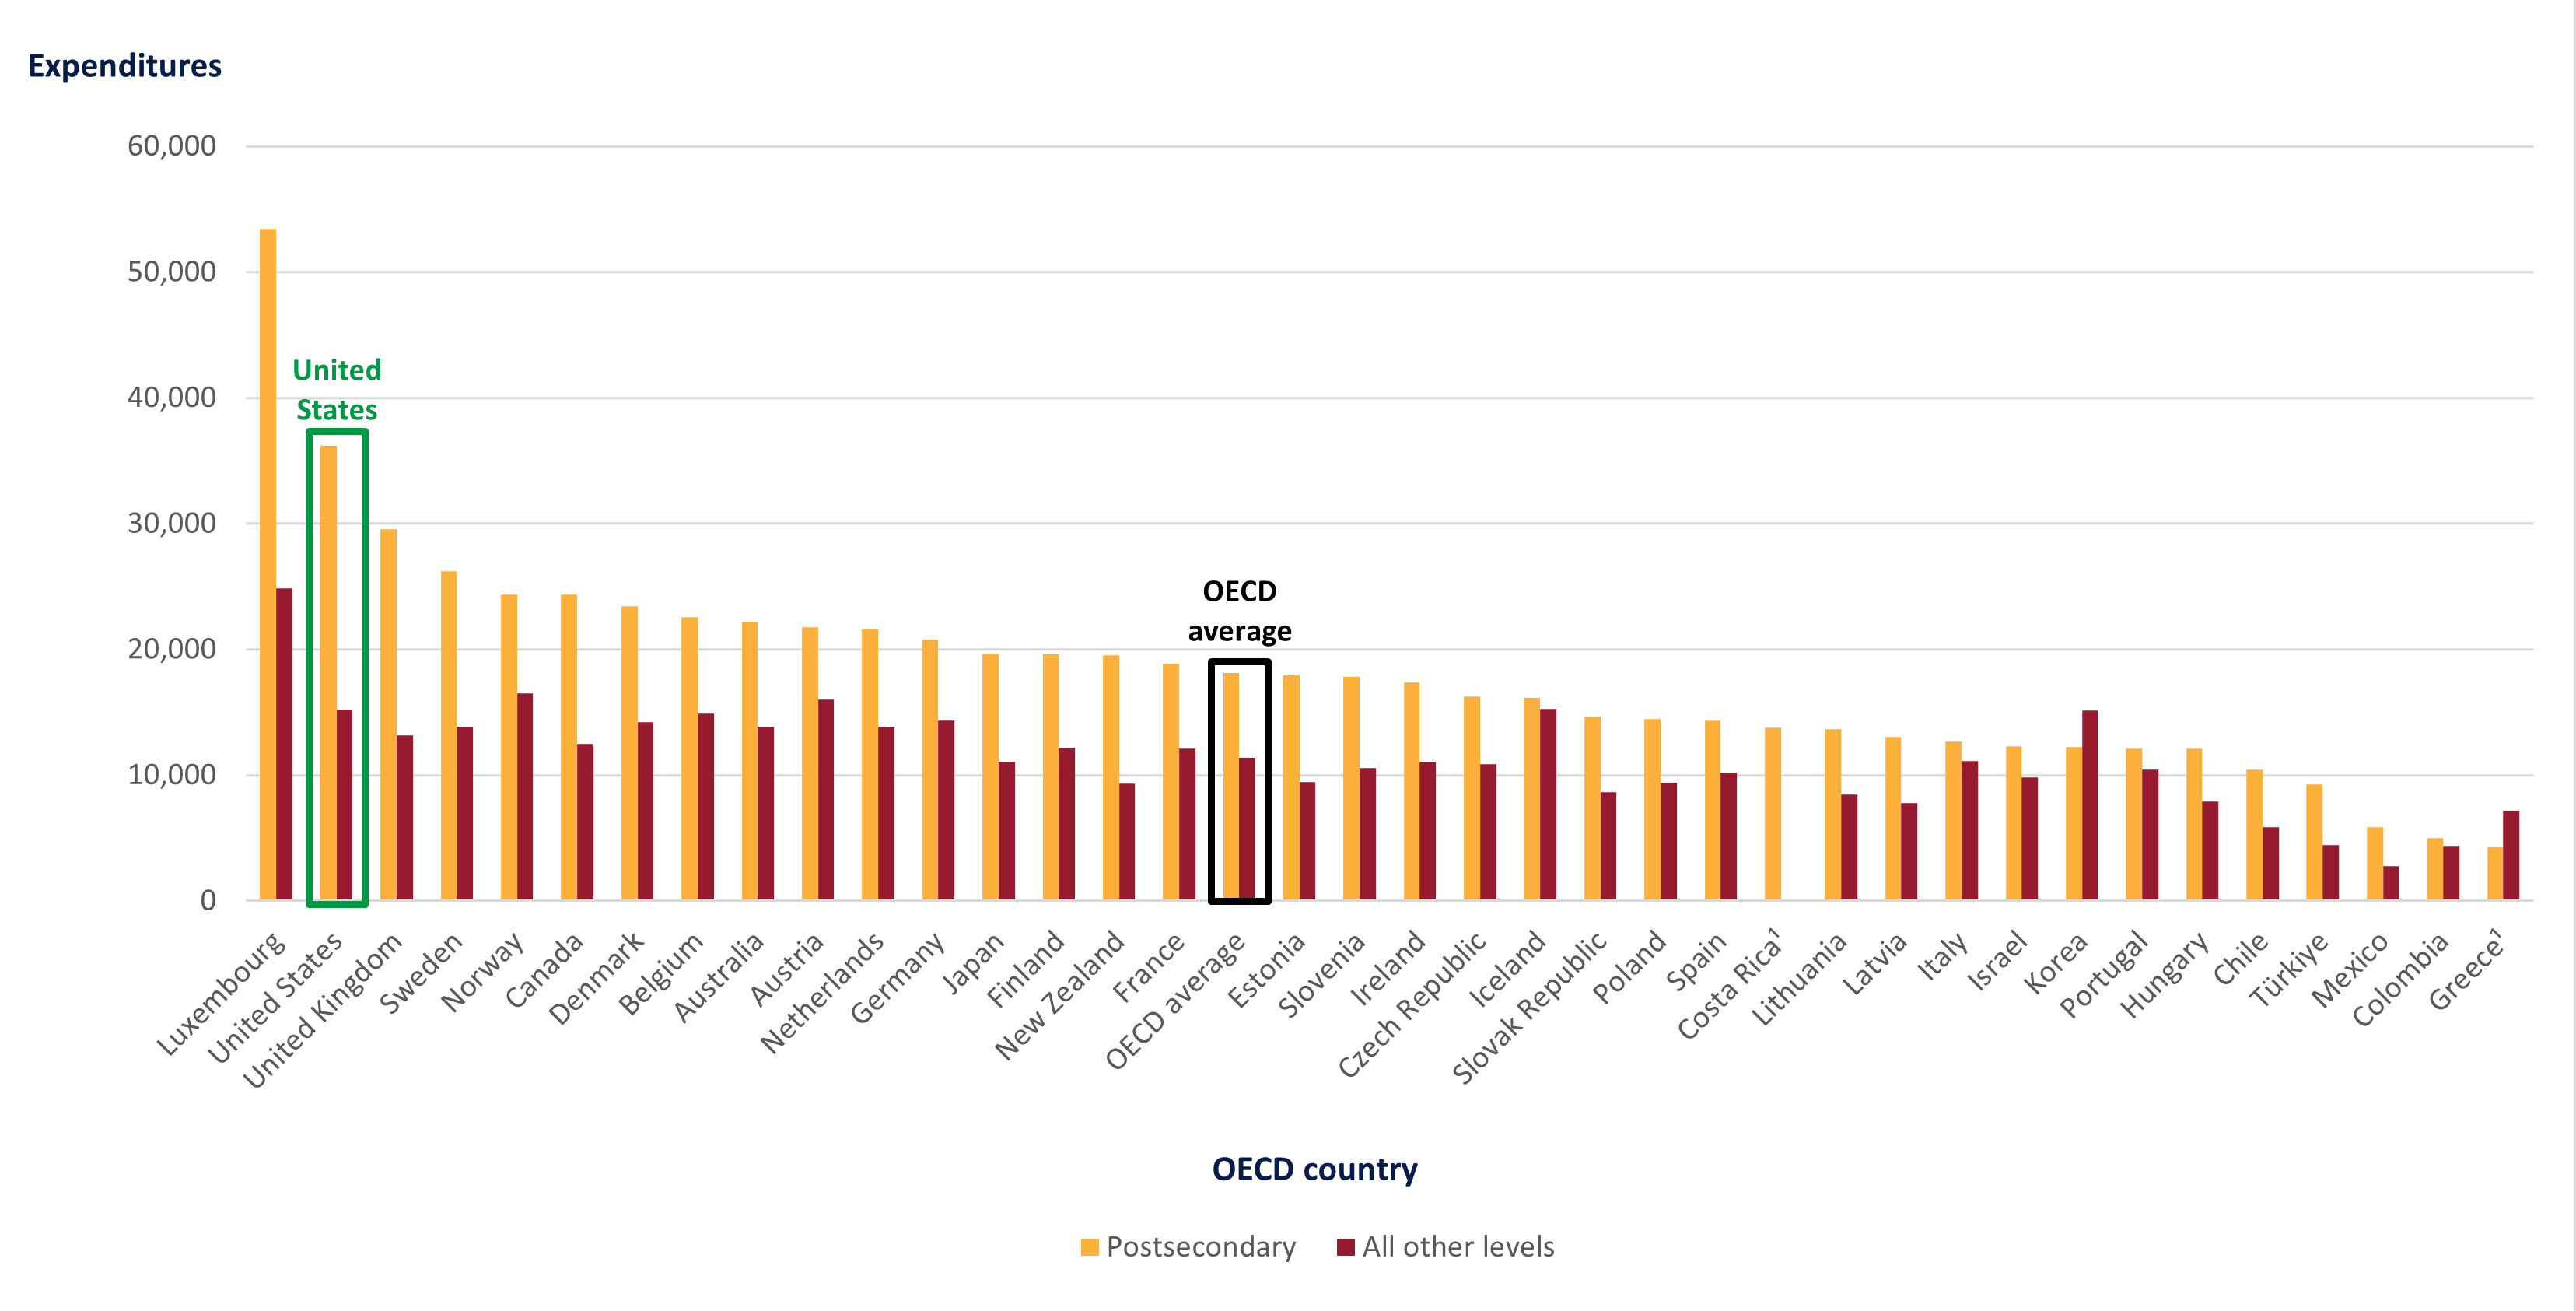
U.S. spending on education is relatively high across all levels of education compared with the OECD average. The largest difference is in postsecondary spending, where the United States spent $36,172 per full-time postsecondary student in 2020, the second highest amount after Luxembourg ($53,421) and nearly double the OECD average ($18,105) (Table C1.1).3 This spending on postsecondary education amounts to 2.5 percent of the U.S. GDP, higher than the OECD average (1.5 percent) (Table C2.1). These total expenditures include amounts received from governments, students, and all other sources.


Figure 2. Expenditures per full-time equivalent student, by education level and OECD country: 2020

[click to enlarge image]
1 Year of reference differs from 2020. Refer to the source table for more details.
SOURCE: OECD (2023), Table C1.1. See Source section for more information and Annex 3 for notes.


High School Completion Rate

The United States has a higher upper secondary (high school) completion rate than most other OECD countries. In 2021, some 87 percent of U.S. students completed their high school program in the expected timeframe, compared with the OECD average of 72 percent (Table B3.1).


Early Childhood Education

The level of participation in early childhood education programs in the United States is below the OECD average. In 2021, average enrollment rates across OECD countries were 72 percent for 3-year-olds, 87 percent for 4-year-olds, and 84 percent for 5-year-olds (Table B2.1). In contrast, enrollment rates for students of these ages in the United States were 30 percent for 3-year-olds, 50 percent for 4-years-olds, and 81 percent for 5-year-olds.  


Browse the full EAG 2023 report to see how the United States compares with other countries on these and other important education-related topics.


By RaeAnne Friesenhahn, AIR, and Cris De Brey, NCES


[1] EAG data for the year 2000 can be accessed via the online OECD Stat database.

[2] Unrounded data in Excel format can be accessed via the StatLink located below each table.

[3] Expenditure in national currencies was converted into equivalent USD by dividing the national currency figure by the purchasing power parity (PPP) index for GDP. For more details on methodology see Annex 2 and Annex 3.